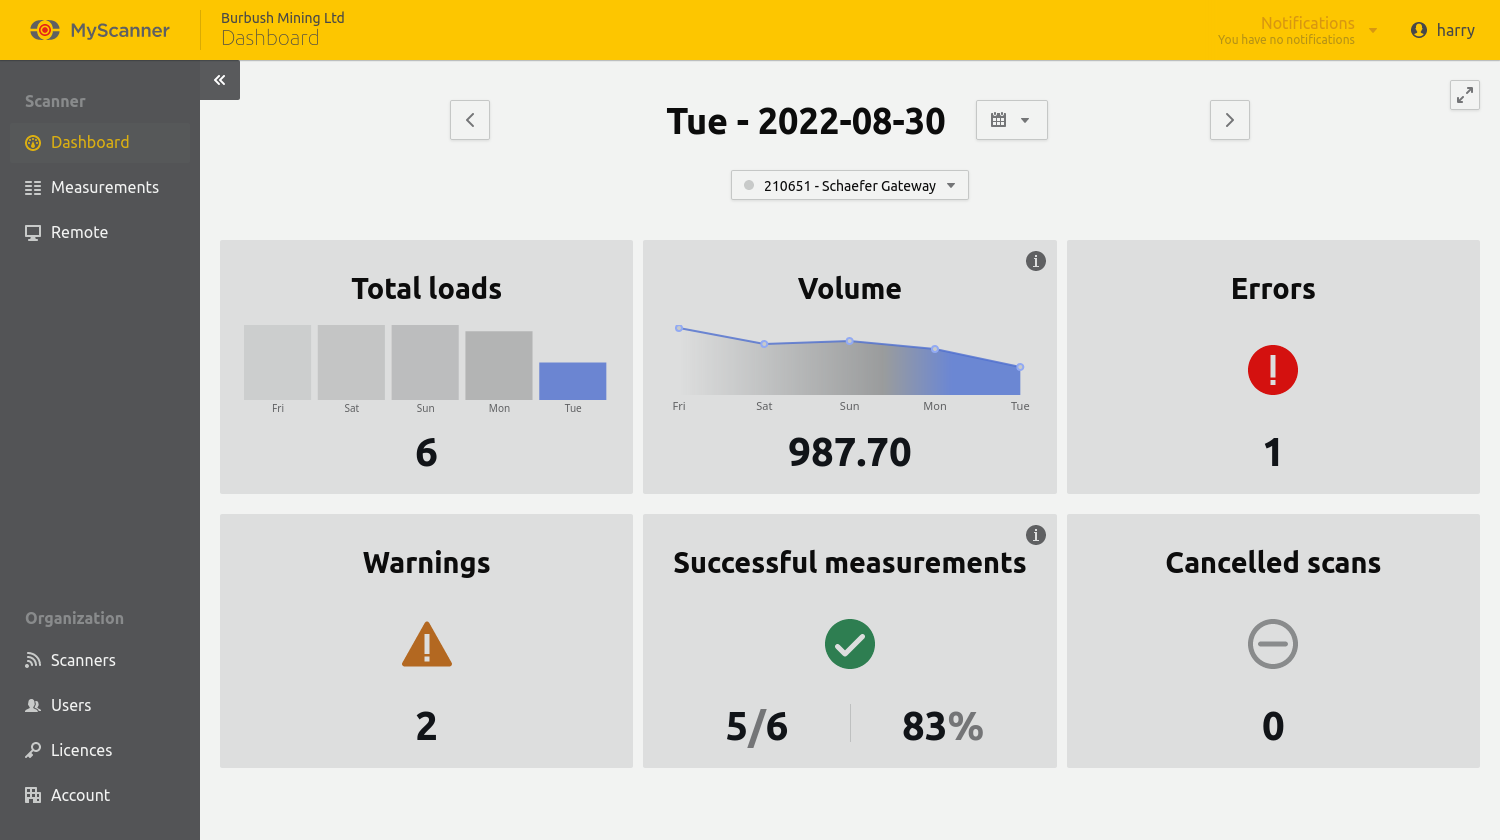
The scanner dashboard gives summary view of a scanner’s activity for the selected day in the scanner’s timezone. 5 day trends are shown for the scanner’s load count and total volume. If dashboard is showing today’s activity it will automatically update to show the latest statistics.
The dashboard can be accessed by selecting the Dashboard menu item from the sidebar or if on mobile using the the Hamburger menu ![]() and selecting your scanner.
and selecting your scanner.
Changing the selected day
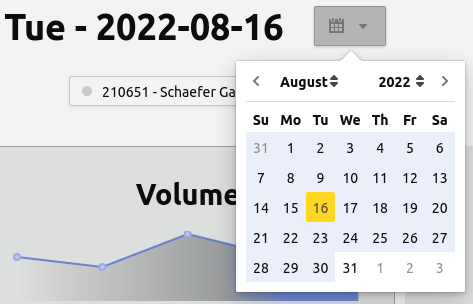
The date picker to the right of the selected day’s title can be used to change what day the dashboard is focused on. Days with scan data in the date picker are highlighted in blue. Alternatively the arrow buttons to the side of the selected day’s title can be used to move forwards or backwards by one day.
The total loads tile
Note!
Scans which are not cancelled contribute to a day’s total loads statistic.
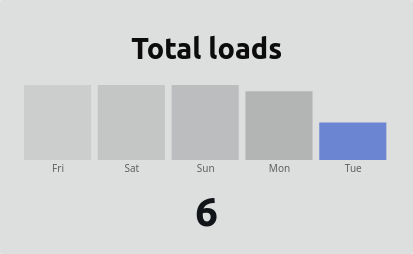
The total loads tile shows the last 5 days’ total loads as a bar chart with the selected day in blue. If a day has no data it will show as a faint ‘X’ in the bar chart. The selected day’s total loads count is displayed at the bottom of the tile. The columns of the bar chart can be clicked to navigate to that day’s measurements in the Measurements page or the tile itself can be clicked navigate to the selected day’s measurements.
The volume tile
Note!
Each bin with no errors contributes to a day’s volume statistic when the parent scan is not cancelled.
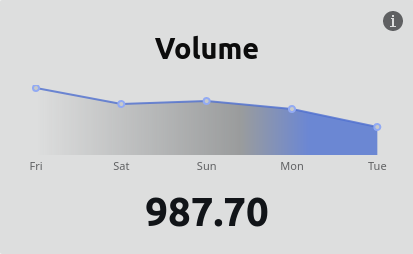
The volume tile plots the last 5 days’ volume measured with the selected day’s volume displayed underneath. The tile can be clicked to navigate to the selected day’s measurements on the Measurements page.
The errors tile
Note!
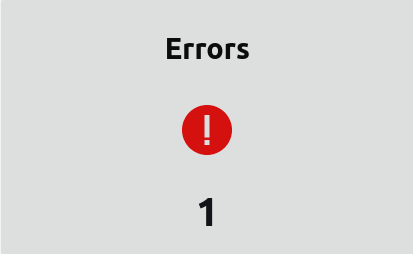
Scans which are not cancelled and have errors contribute to a day’s error statistic.
The errors tile displays the total scans with errors for the selected day. The tile can be clicked to navigate to the selected day’s measurements with errors on the Measurements page.
The warnings tile
Note!
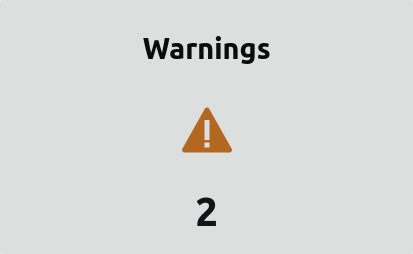
Scans which are not cancelled and have one or more warnings to contribute a day’s warning statistic.
The warning tile is only available for scanners configured to use the latest logfile format.
The warnings tile displays the total scans with warnings for the selected day. The tile can be clicked to navigate to the selected day’s measurements with warnings on the Measurements page.
The success tile
Note!
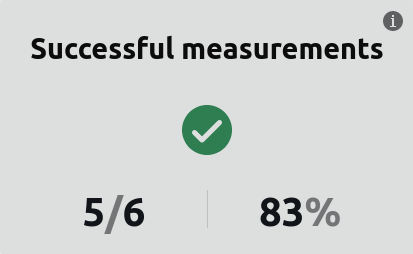
Successful scans includes uncancelled scans that have no errors. Successful scans can have warnings, this is different to the success filter behaviour on the measurements page which will not automatically include scans that have warnings.
The success tile displays a percentage of the day’s successful scans and a ratio comparing successful scans against total loads. The tile can be clicked to navigate to the selected day’s measurements which meet the tile’s success criteria on the Measurements page.
The cancelled scans tile
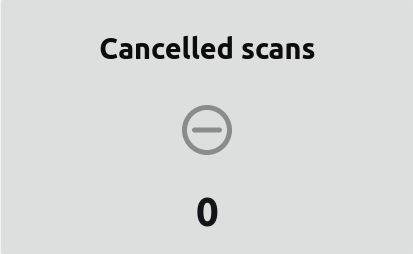
The cancelled scans tile displays a count of the day’s cancelled scans. The tile can be clicked to navigate to the selected day’s measurements which which have been cancelled on the Measurements page.
In this Article
The scanner dashboard gives summary view of a scanner’s activity for the selected day in the scanner’s timezone. 5 day trends are shown for the scanner’s load count and total volume. If dashboard is showing today’s activity it will automatically update to show the latest statistics.
The dashboard can be accessed by selecting the Dashboard menu item from the sidebar or if on mobile using the the Hamburger menu ![]() and selecting your scanner.
and selecting your scanner.

Changing the selected day
The date picker to the right of the selected day’s title can be used to change what day the dashboard is focused on. Days with scan data in the date picker are highlighted in blue. Alternatively the arrow buttons to the side of the selected day’s title can be used to move forwards or backwards by one day.

The total loads tile
Note!
Scans which are not cancelled contribute to a day’s total loads statistic.
The total loads tile shows the last 5 days’ total loads as a bar chart with the selected day in blue. If a day has no data it will show as a faint ‘X’ in the bar chart. The selected day’s total loads count is displayed at the bottom of the tile. The columns of the bar chart can be clicked to navigate to that day’s measurements in the Measurements page or the tile itself can be clicked navigate to the selected day’s measurements.

The volume tile
Note!
Each bin with no errors contributes to a day’s volume statistic when the parent scan is not cancelled.
The volume tile plots the last 5 days’ volume measured with the selected day’s volume displayed underneath. The tile can be clicked to navigate to the selected day’s measurements on the Measurements page.

The errors tile
Note!
Scans which are not cancelled and have errors contribute to a day’s error statistic.
The errors tile displays the total scans with errors for the selected day. The tile can be clicked to navigate to the selected day’s measurements with errors on the Measurements page.

The warnings tile
Note!
Scans which are not cancelled and have one or more warnings to contribute a day’s warning statistic.
The warning tile is only available for scanners configured to use the latest logfile format.
The warnings tile displays the total scans with warnings for the selected day. The tile can be clicked to navigate to the selected day’s measurements with warnings on the Measurements page.

The success tile
Note!
Successful scans includes uncancelled scans that have no errors. Successful scans can have warnings, this is different to the success filter behaviour on the measurements page which will not automatically include scans that have warnings.
The success tile displays a percentage of the day’s successful scans and a ratio comparing successful scans against total loads. The tile can be clicked to navigate to the selected day’s measurements which meet the tile’s success criteria on the Measurements page.

The cancelled scans tile
The cancelled scans tile displays a count of the day’s cancelled scans. The tile can be clicked to navigate to the selected day’s measurements which which have been cancelled on the Measurements page.

